
LIght Detection And Ranging
|
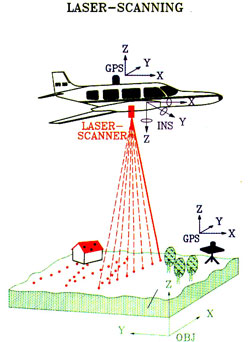
LIDAR is a remote sensing technique that maps a 3 dimensional view of your property with a high degree of accuracy.
The system is usually flown at 1-2,000 m above the ground and incorporates:-
|
|
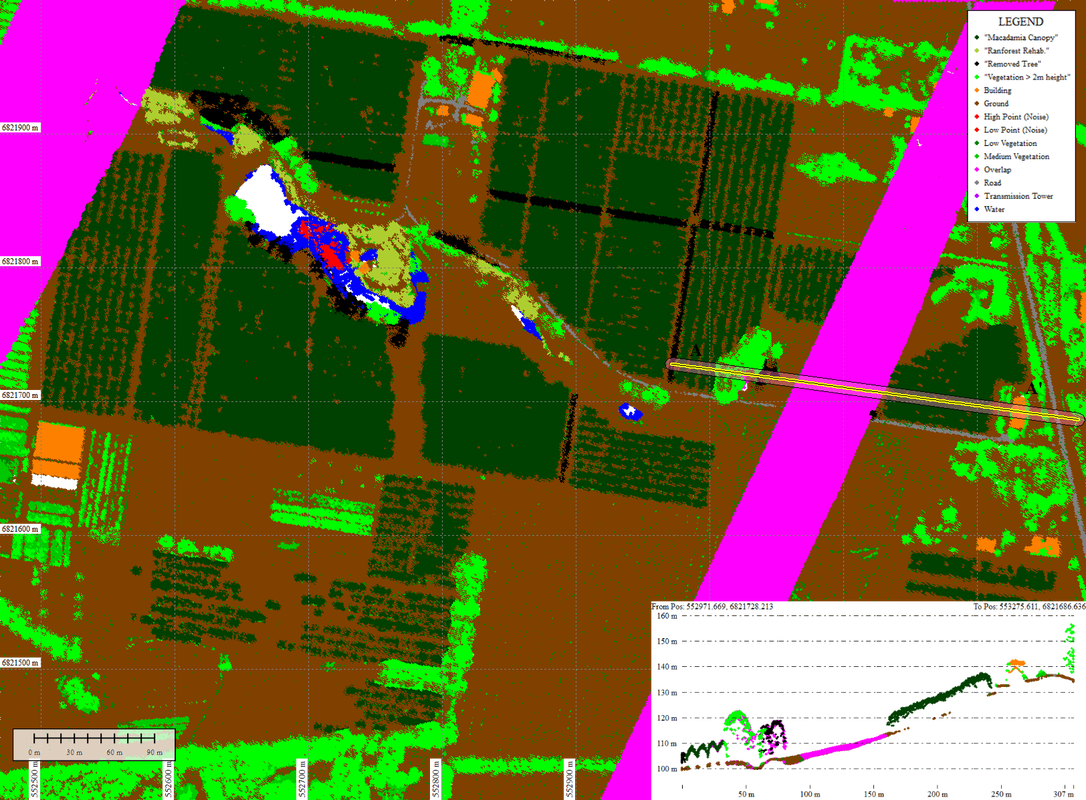
The output from a LIDAR survey is a point cloud where every point has an x, y and z coordinate together with a number of attributes such as classification (building, ground, vegetation, water, etc), intensity, scan angle , return number, etc.
Other attributes can be calculated (height above ground) and RGB colours for every point can be merged from aerial photography.
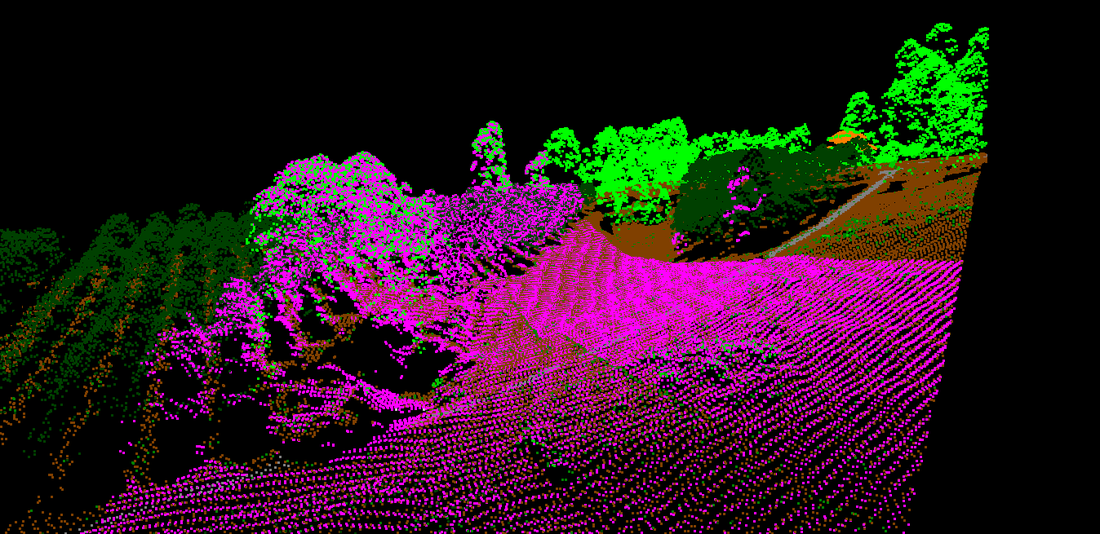
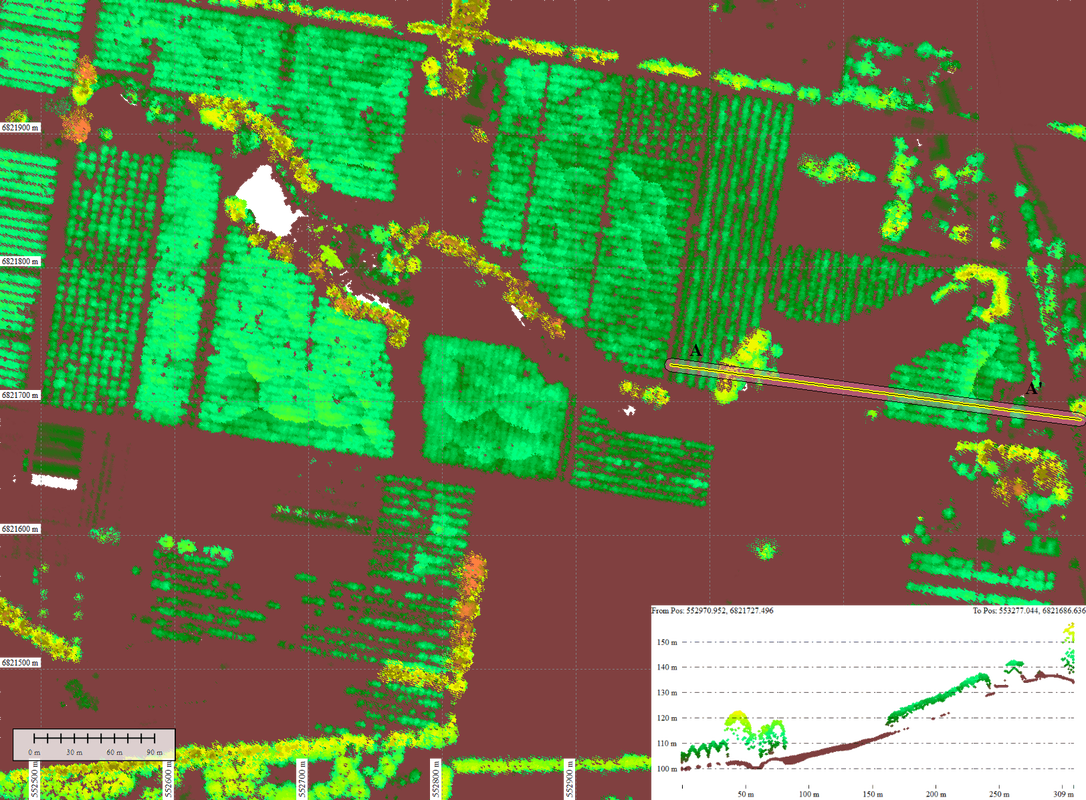
The following diagrams display LIDAR points in plan, section and oblique view coloured by attribute to give an indication of what the raw data is like.
Other attributes can be calculated (height above ground) and RGB colours for every point can be merged from aerial photography.
The following diagrams display LIDAR points in plan, section and oblique view coloured by attribute to give an indication of what the raw data is like.
|
Classified Points
|
|
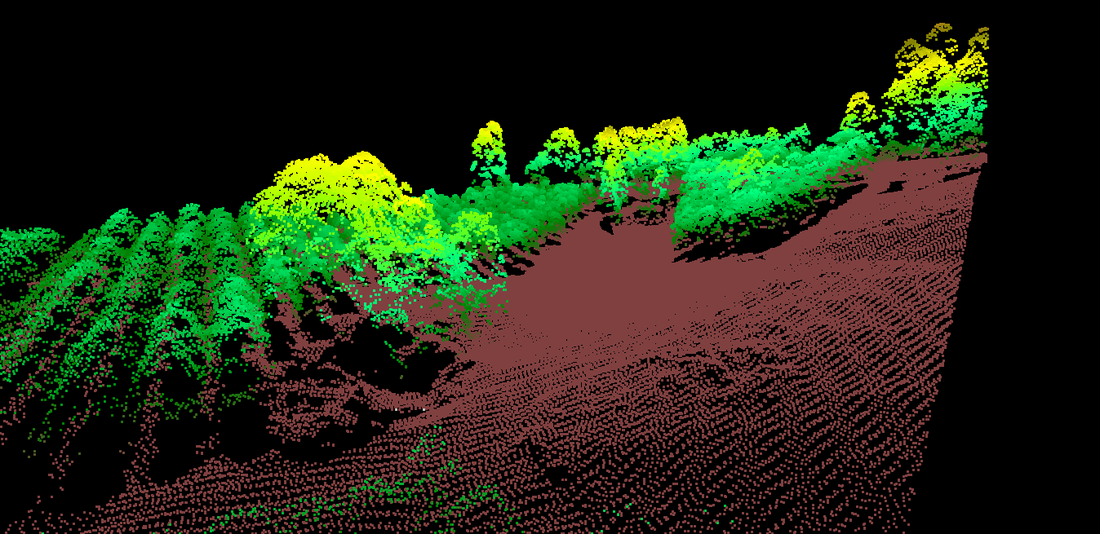
Height Above Ground
|
|
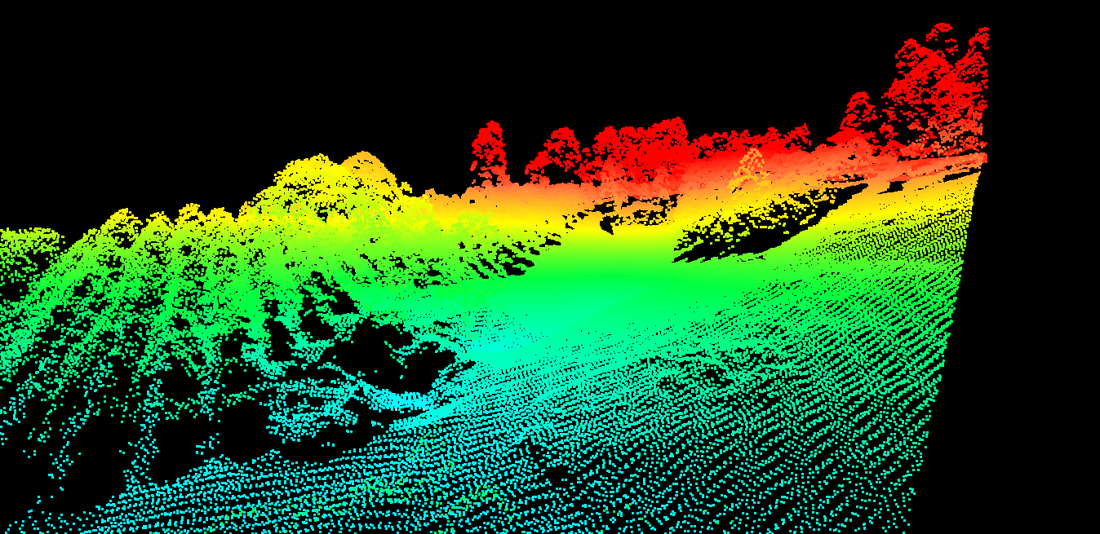
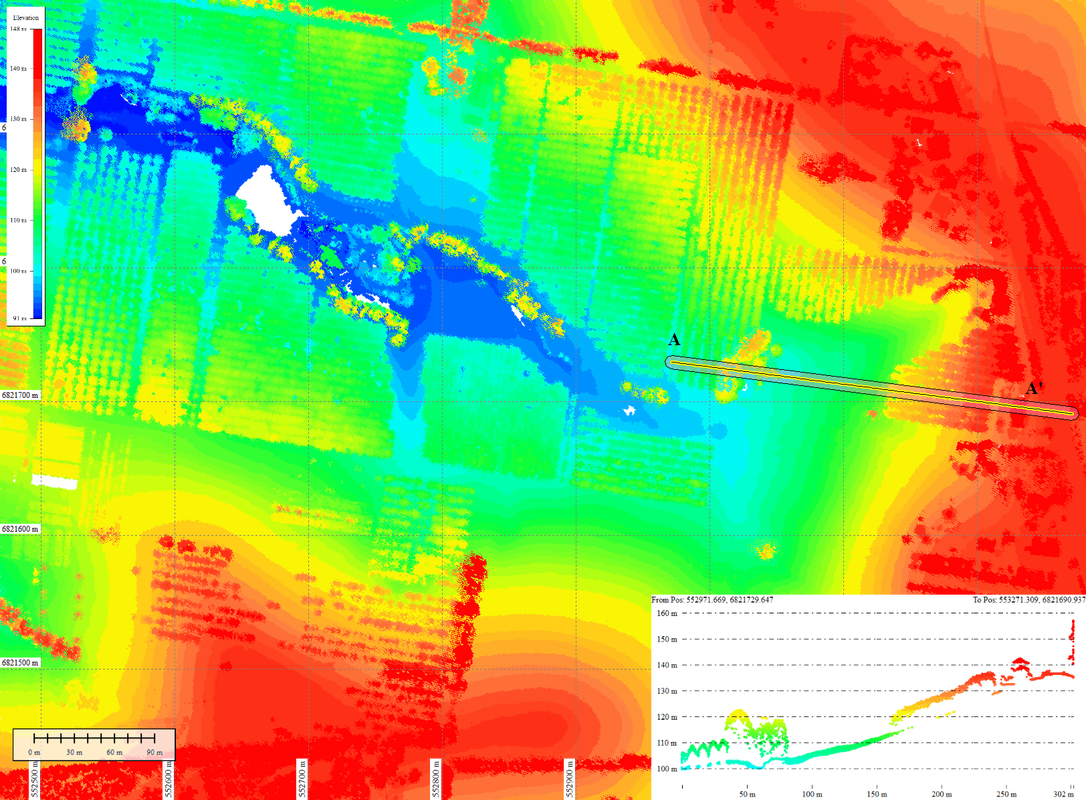
Elevation
|

|
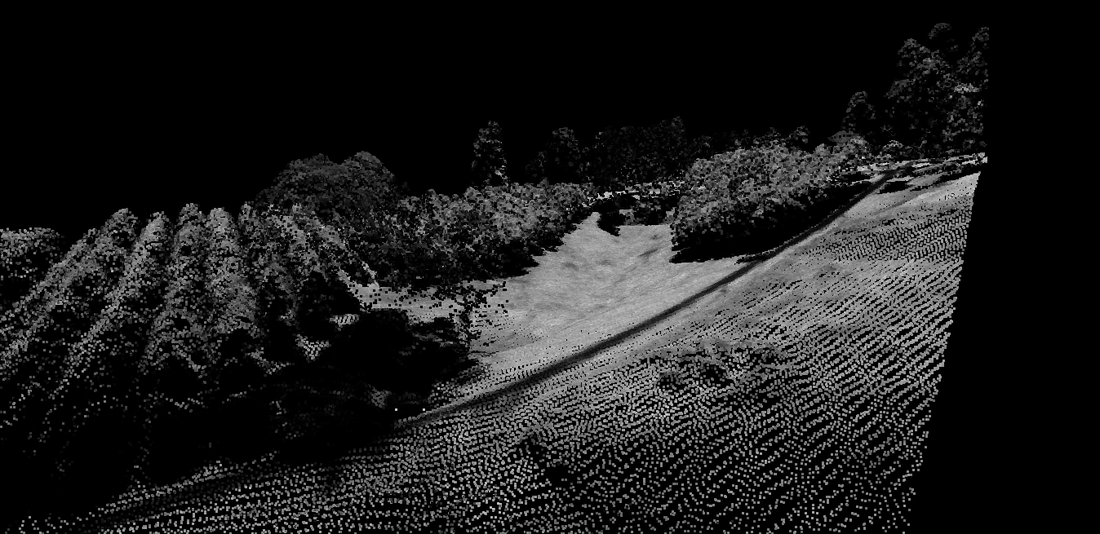
Return Intensity
|

|
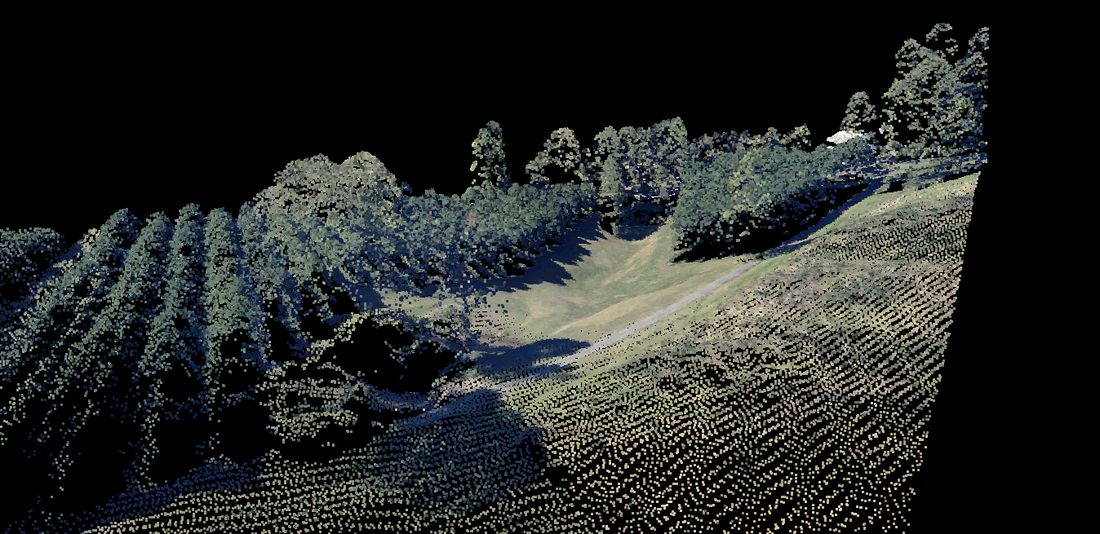
RGB colours merged from aerial photography
|